Posted by Ray Poynter 19 October 2018
If we are told that a before a marketing campaign the sales were at 10,000 units a month, and after the campaign sales are 20,000 units a month, then it is easy to assume that the campaign has increased sales by 10,000 units a month, or by 100%. However, this is an example of the classic fallacy “Post hoc ergo propter hoc” (which is Latin for ‘after this, therefore because of this’.
Consider the chart below, an edited and anonymised version of a presentation I saw at a conference last year.
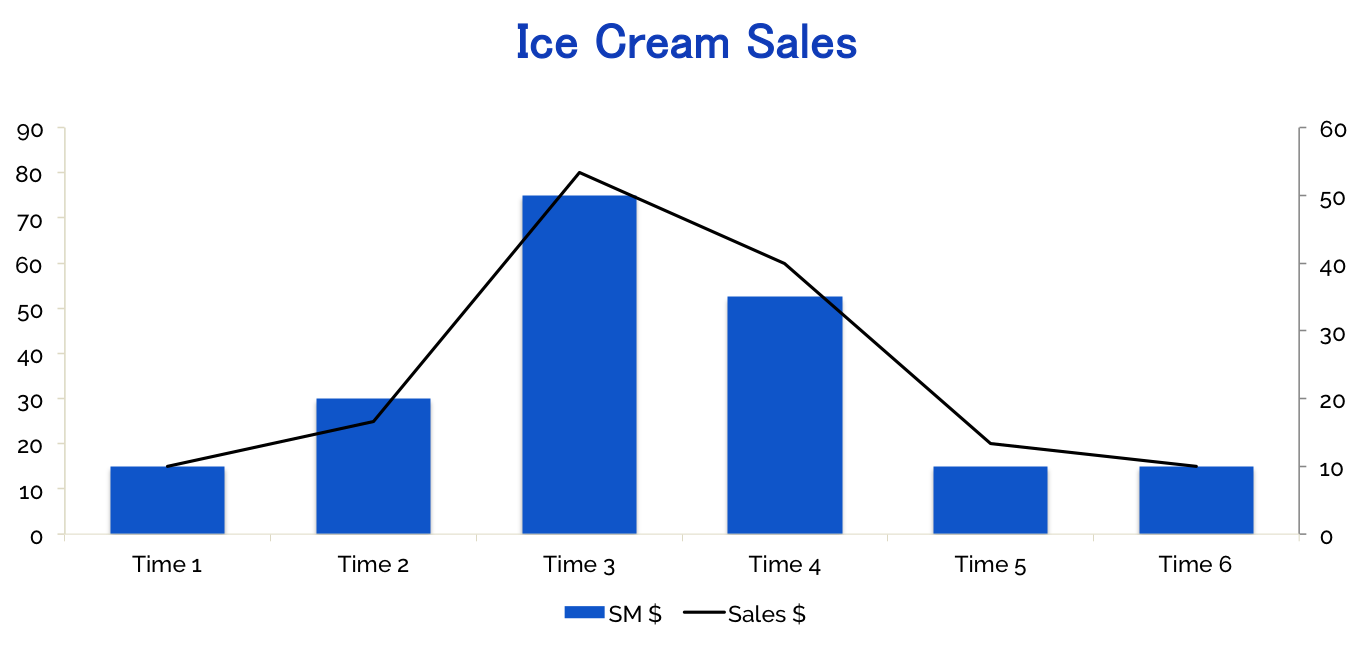
The chart was presented by the head of social media to the head of insight in a company selling ice cream. The head of social media protested that the spend on social media advertising should be maintained at a high level. He pointed out that when social media advertising was increased sales, increased, and when the advertising budget was cut, the sales dropped. Therefore, the advertising budget should be increased, so that the advertising could be maintained at the higher level.
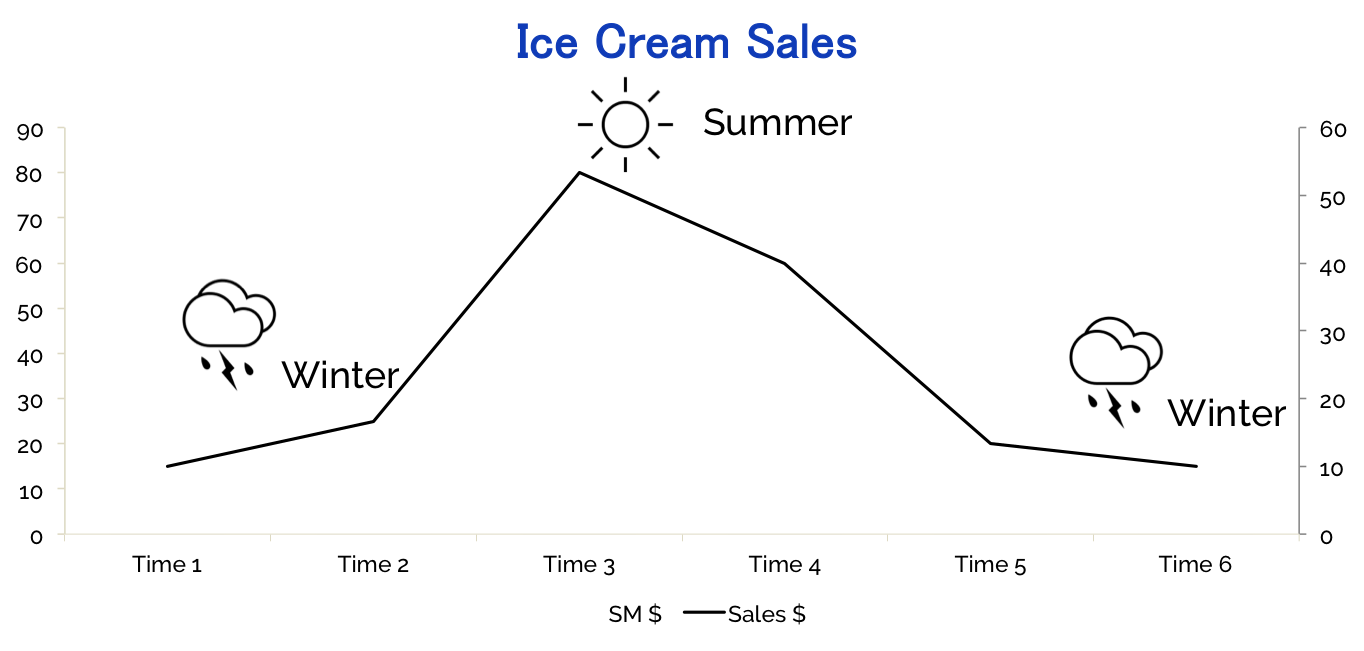
However, the head of insight took out her pen and scribbled onto the chart three words and images, as in the chart below.
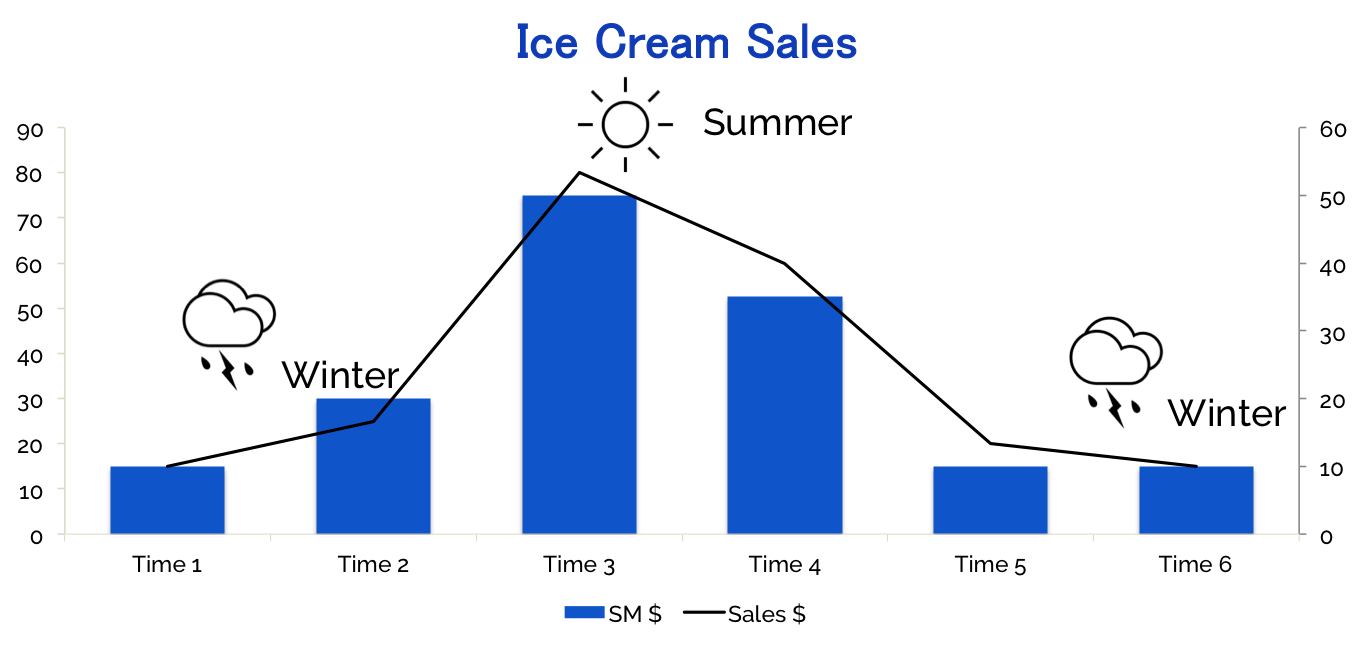
The point she made was that the sales of ice cream were being driven by the seasons, which in turn was also the likely driver of the social media advertising programme. What the social media marketer needed to do was consider the counterfactual, what would have happened without the campaign. The chart below shows the counterfactual in this ice cream case.
The lesson from this post is that whenever we assess the impact of an action, for example a marketing campaign, we need to consider the counterfactual, what would have happened without the campaign. The best way of looking at the counterfactual is to construct an experiment with control and test cells – the control cell is the counterfactual. When a test and control experiment is not available, other options include, post-event matching (where people who were exposed to the campaign are matched with people who were not exposed), data from earlier periods (e.g. the previous year), econometric modelling, and predictions (e.g. sales forecasts, targets, plans.)